

Blog
How to Rate Popup Performance Through the Analytics Extension
Modern analytic technologies have made it easier to examine data sets and to draw conclusions. Due to this, businesses can make more precise decisions, increase their overall performance and improve customer service. This way they will be able to foresee the developing marketing trends and thus, become more competitive in the market. In this article, let’s explore how you can rate the performance of popups through a special tool called analytics extension.
Rating Popup Performance
Having created many popups you might wonder how they perform on your website. That’s where the analytics extension can be really useful. Through this amazing tool you can get statistics on popup performance and improve it. For this purpose, configure analytic settings. Just select the popup you would like to track and set the date range for which you would like to track popup event performance. The data are available for the preceding month, the preceding week, the preceding day and the same day. Afterward, select the events to track and analyse the results.
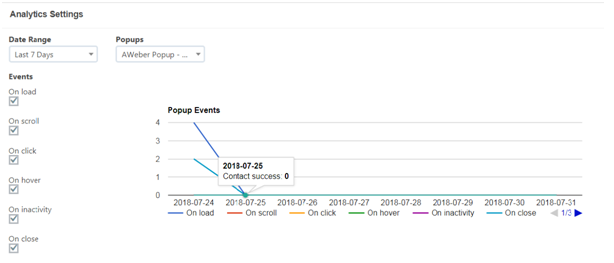
Let’s have a look at the analytics data for our AWeber popup. Below, we have shown the analytics data for the last 7 days and for “on load”, “on scroll”, “on click”, “on hover”, “on inactivity”, “on close” events. AWeber popup opened 2 times on close and 4 times on load. But as you can see, contact success is zero. This means that users trying to subscribe made mistakes while filling in personal and/or contact information.
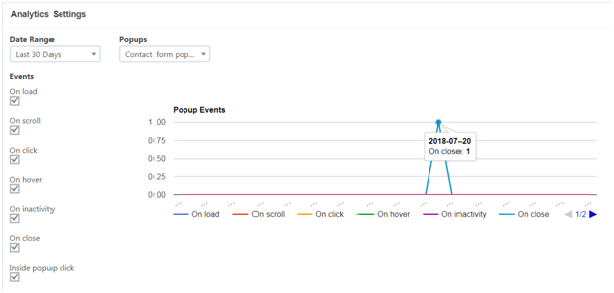
Now, come along to discover the analytic settings for Contact form popup. Here we have set the date range for the previous 30 days and have selected “on load”, “on scroll”, “on click”, “on hover”, “on inactivity”, “on close”, “inside popup click” events. As the analytics shows, contact form popup opened once with the “On close” event on the 20th of July.
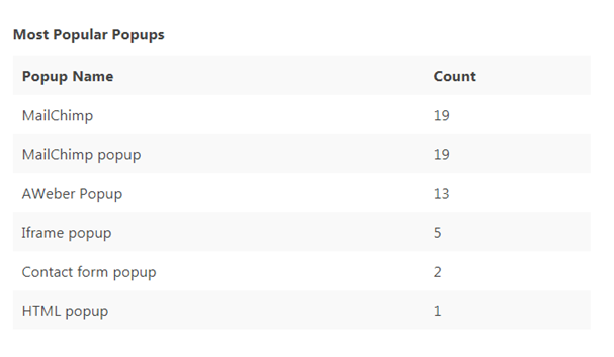
Through this extension, you can find out which are your most popular popups for a particular period of time. Due to this functionality, you can analyse the behavior of your visitors as to which popup has opened most often and which event has made the popup more polite and engaging.
In Conclusion
Analytics is the discovery and interpretation of data used to foresee and make business performance better. The results are applied to ease the decision-making process. Analytics gives us valuable information that wouldn’t be available otherwise. In this data-driven world, information is power and analytics is a tool that can give us this information. Analytics assists us in exploring the behaviour of our visitors that would otherwise be hidden from us. So, with analytics, it’s much easier to find out some drawbacks and to improve them. Popup analytics extension performs the same functionalities. More specifically, it discovers and interprets popup event performance. Then, you can use this data to predict and improve your business.